

In the intricate world of web development and troubleshooting, understanding the network activities of web applications is crucial. Herein lies the significance of HTTP Archive (HAR) files, a powerful tool in the arsenal of developers, QA engineers, and IT specialists. HAR files provide a comprehensive snapshot of a web browser’s interactions with a site, capturing detailed information about each request and response exchanged between the client and server. This article guides you through creating, collecting, and analyzing HAR files to efficiently triage web applications.
What are HAR Files?
HAR files, standardized by the W3C, document the journey of web requests from initiation to response, encapsulating details such as headers, cookies, payload data, and timing information. This makes them invaluable for diagnosing network-related issues, performance bottlenecks, and unexpected behavior in web applications.
Creating and Collecting HAR Files
The process of generating HAR files is straightforward, with most modern web browsers (e.g., Chrome, Firefox, Safari) providing built-in tools or extensions to facilitate this task. Here’s how you can create a HAR file using Google Chrome’s Developer Tools:
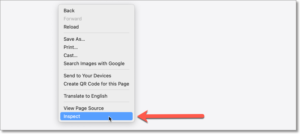
- Open Developer Tools: Navigate to the web page you wish to analyze, right-click anywhere on the page, and select “Inspect” or use the shortcut
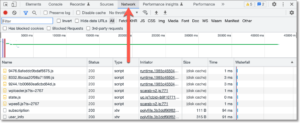
Ctrl+Shift+I(Cmd+Option+Ion Mac) to open the Developer Tools. - Access the Network Tab: Click on the “Network” tab to start capturing network activity. Ensure the record button (the red circle at the top-left of the Network tab) is active. If it’s grayed out, click it to start recording.
- Reproduce the Issue: With recording in progress, reproduce the issue or complete the actions you want to analyze. The Network tab will capture and list all network requests and responses.
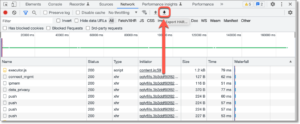
- Save as HAR File: Right-click within the Network tab, select “Save all as HAR with content,” and choose your desired save location.
Analyzing HAR Files
Once you have a HAR file, the next step is to analyze its contents to identify potential issues or areas for optimization. Several tools and methodologies can aid in this analysis:
- Manual Analysis: Open the HAR file with a text editor to manually inspect the JSON-formatted content. This approach is best for experienced developers familiar with network requests and responses.
- Online Analyzers: Tools like Google’s HAR Analyzer or software like Charles and Fiddler offer user-friendly interfaces to import and scrutinize HAR files. These platforms highlight critical insights such as slow-loading resources, failed requests, and excessive DNS lookups. See https://toolbox.googleapps.com/apps/har_analyzer/
- Custom Scripts: For advanced analysis, custom scripts can parse HAR files, aggregating data, and identifying patterns. Python, with libraries such as
haralyzer, can automate this process, offering deeper insights into performance metrics and anomalies.
Best Practices for HAR Files
- Privacy Consideration: HAR files can contain sensitive data, including cookies, API keys, and personal information. Always sanitize HAR files before sharing and only distribute them in a secure manner.
- Comprehensive Collection: To ensure a thorough analysis, capture HAR files across different browsers and devices. This diversity can uncover browser-specific issues or device-related performance problems.
- Regular Audits: Incorporate HAR file analysis into your regular web application audit routines. This practice helps in proactively identifying and mitigating potential issues before they impact end-users.
Conclusion
HAR files are a linchpin in the web development toolkit, offering a detailed lens through which to view the web application’s network activity. By mastering the creation, collection, and analysis of HAR files, professionals can enhance their ability to triage, optimize, and secure web applications. As web technologies evolve, the role of HAR files in ensuring seamless, efficient, and secure web experiences remains undiminished, making them an essential skill for web professionals.
Below are some brief instructions for each browser:
Generate HAR files
You can generate a HAR file within most web browsers using the built-in developer or inspector tools.
Google Chrome
- Go to View > Developer > Developers Tools or Right-Click the mouse and select “Inspect”.
- In the Developer Tools pane, choose the Network tab.
- Check the Preserve Log checkbox to record all interactions.
- Visit the page and complete the steps that trigger the issue.
- Choose the Network tab.
- Click the down arrow to export the HAR file.
- Save the HAR file.
Safari
- Ensure that Show Develop menu in menu bar checkbox is checked under Safari > Preferences > Advanced.
- Choose File > Open New Private Window.
- Choose Show Web Inspector in the Developer menu, then navigate to the Network tab.
- To the right of All near the top-left of the Web Inspector, click the Filter button and choose Preserve Log.
- Visit the web page where the issue occurs.
- Choose Develop > Show Web Inspector. The Web Inspector window appears.
- Complete the steps on the page that trigger the issue.
- Select the Network tab.
- Click Export on the upper right side of the pane.
- Save the HAR file.
Firefox
- Close all private windows in Firefox.
- Open a new private window in Firefox.
- Go to Tools > Developer > Network (Ctrl + Shift + E).
- Click the Network tab and choose Persist Logs.
- Visit the page and complete the steps that trigger the issue.
- Choose the Network tab and right click and then select Save All As Har.
- Save the HAR file.
Microsoft Edge
- Close all InPrivate windows in Microsoft Edge.
- Open a new InPrivate window (Ctrl + Shift + N).
- Go to Settings and more (the … icon) then choose More Tools > Developer Tools.
- Start a profiling session on the Network tab of the Developer Tools toolbar.
- Visit the page and complete the steps that trigger the issue.
- Select Export as HAR (Ctrl + S) and save the HAR file.
Internet Explorer
- Close all InPrivate windows in Internet Explorer.
- Open a new InPrivate window in Internet Explorer (Ctrl + Shift + P).
- Go to Tools > F12 Developer Options > Network.
- Ensure Clear entries on navigate is switched off.
- Visit the page and complete the steps that trigger the issue.
- Choose the Network tab and select Export as HAR (Ctrl + S).
- Save the HAR file.


More Stories
Implementing Site-to-Site Double VPN for Enhanced Security: A Comprehensive Guide
Engineering a Node.js Web Scraper: Learn How to Unleash SEO Superpowers
GIMP & Digital Art – Open Source your Arts, the Sky is the Limit
Unveiling the Akai MPK Mini: A Compact Powerhouse for Music Creatives
Exploring the Flipper Zero: The Multi-Tool for Modern Hackers
Comprehensive Network Diagnostics with Batch Scripting